By Rick Sohn
Umpqua Coquille LLC
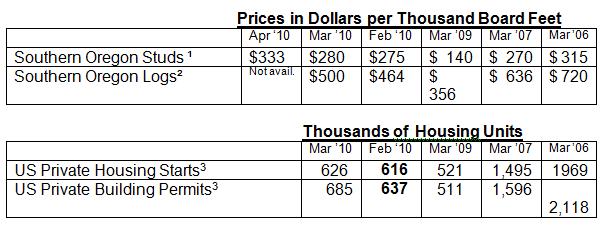
Good news as we near the one-year anniversary of the lows for lumber, logs, housing starts, and building permits. Prices jumped for lumber and logs. But why are lumber prices similar to the time when we had around 2 million annual housing starts, yet there is only one third of that today? See four-year price analysis of lumber, logs, housing starts, permits, unsold home inventory, and mortgage rates below.
Interpreting the trends.
Wow. No need to sneeze at either the $53, 18% jump in lumber prices in April, nor the $36, 8% rise in log prices in March, nor the 5-month drop in unsold inventory of homes.. There is good news all around – every statistic tracked above made progress in the most recent month for log and lumber producers. These prices will help dig out of the holes that companies dug, so as to hold onto the operations and employees that they still have.
We are approaching the one-year anniversary of the lows for our key statistics. The $140 reported in March 2009 for lumber is the low of this depression cycle for wood products. And April, 2009 prices for logs ($346), housing starts (479,000) and building permits (498,000), are also lows. Relatively speaking these numbers look good, but the reason I print prices back to 2006 is for the context. We have a long way to go. Interestingly, logs got to the highs of today with a steady climb every month since last April, while lumber and the housing stats have had jagged recoveries with 4-5 jumps and dips each, within the year. Interestingly, studs made a complete rebound since 2006.
But will the current prices hold, or will the jagged fits and starts in prices begin to trend down? And what caused these increases? If these prices are firmed up for 3 or more months, then some local executives feel the recovery will have legs. However, most are uncertain the prices will hold, because the fundamentals do not support the demand now. The last time Southern Oregon Studs price was in the $330 range was early ’06, near the tail end of the boom times, and housing starts and building permits were still in excess of 1.8 million per year, rather than today’s 700,000.
One newer factor is increased demand from Asia, both for lumber and logs. The Asian demand is up, partly due to our currently low prices. Countering this to some extent, log imports to the U.S. from Canada are also up.
One other factor, exacerbated by Asian demand, is contributing to increased log prices. All around there was a shortage of winter logs in the Northwest. Few log sellers wanted to log with the projected low revenues from log sales, therefore few made the 2009 investments in gravel necessary for winterized roads. If price patterns return to normal, log prices should drop in the summer when the volume of logging can increase on natural surface roads.
With the uncertain future of lumber prices, it is no wonder that the producers are particularly nervous about paying the current higher log prices. While manufacturers complain about the rise in log prices, the fact is that lumber prices have kept ahead — for now. But what will lumber prices be in the future? That’s the uncertainty that makes the log-buying manufacturers understandably nervous.
Data reports used with permission of:
1) Random Lengths. 2”x4”x8’ precision end trimmed hem-fir studs from southern Oregon mills. Price reported is Dollars per Thousand Board Feet for the most recent week. One “board foot” of product measures 12 inches by 12 inches by one inch thick.
2) RISI, Log Lines. Douglas-fir #2 Sawmill Log Average Region 5 price. Current report is for the prior month. Dollars per Thousand Board Feet of logs are reported using standardized log measurements from the “Scribner log table.”
3) Dept. of Commerce, US Census Bureau. New Residential Housing Starts and New Residential Construction Permits, annually adjusted. Current report is for the prior month. Recent reports are often revised in bold from the prior month.
4) Regional Multiple Listing Service RMLSTM data, courtesy of Janet Johnston, Prudential Real Estate Professionals Broker, Roseburg, OR. Inventory of Unsold Homes (Ratio of Active Listings to Closed Sales) in Portland Oregon, for most recent month available.
5) Freddie Mac. Primary Mortgage Market Survey. 30-year Fixed Rate Mortgages Since 1971, national averages. Updated weekly, current report is for the prior full month.
© Copyright Rick Sohn, #3-5 Umpqua Coquille LLC. Email [email protected]
Disclaimer: Articles featured on Oregon Report are the creation, responsibility and opinion of the authoring individual or organization which is featured at the top of every article.


