By Rick Sohn, PhD
Umpqua Coqullie LLC
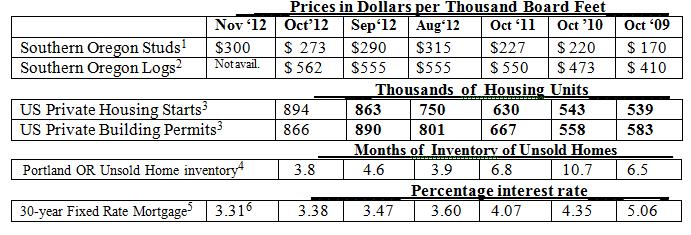
Encouraging news this month for homeowners and wood products manufacturers. Four-year market trends of lumber, logs, housing, and mortgage statistics are shown below.
Interpretation
Major hurricanes, such as Superstorm Sandy, cause damaged homeowners to turn to wood products for repairs, rebuilding, and remodeling. The $27 rise in stud prices is influenced by a spike in demand for homebuilding products because of Hurricane Sandy. Yet, October ’09 and October and November of ’10 were also periods of similar rises in the product prices, without similar specific causes, except for tight inventories.
During the fall, when most log inventories are at their highest for the mills, and non-gravel roads are still used for logging, log prices normally begin to fall. This year there has been a trend of rising prices, as predicted again last month, due to the impact of the late fire season and early rains. This rise of log prices in the fall also happened in 2010 and 2011. In August and September, lumber prices were less than half the log price, which benefits the mills. Will next month be again like August and September?
Just when we thought – yet again—that interest rates would not go any lower, there is a post-election drop in mortgage interest rates, to new lows, as a result of current and anticipated federal economic policies. How much lower can interest rates go? Even savvy homeowners who have refinanced one or more times, may reconsider and do it again. Generally, any fall in interest rates, of 0.75 to 1 full percentage point, can justify refinancing.
Refinancing may be justified for another reason – the impending threat of a modified or lost mortgage interest tax deduction, as lawmakers consider programs to avert the fiscal cliff.
The trend in Housing Starts and Building Permits, of at least one new high every month, continues for the 10th month of 2012, with a new 2012 record number, this time in Private Housing Starts.
While not generally reported in this newsletter, due to its additional month of lag in reporting, the Oregonian reports that the Standard and Poor’s Case-Schiller Home Price Index for Portland rose 0.21 percent in the last month and 3.7% in 2012. Fifteen out of 20 cities tracked, reported increases in September. Nationally, prices are up 0.24% for the month and 3% since a year ago. Portland is somewhat stronger than the national average for the year. There have been 6 straight months of gains in home prices nationally, signaling the beginning of the home value recovery, finally.
Data reports used with permission of:
1Random Lengths. Through Sept. 2012, 2”x4”x8’ precision end trimmed hem-fir stud grade from Southern Oregon mills. Starting Oct. 2012 the stud grade has been consolidated with and will be reported as Kiln Dried Studs, Coast Hem-Fir 2x4x8’ PET #2/#2&Btr. Price reported is Dollars per Thousand Board Feet generally for the third week of the month. One “board foot” of product measures 12 inches by 12 inches by one inch thick.
2RISI, Log Lines. Douglas-fir #2 Sawmill Log Average Region 5 price. Current report is for the prior month. Dollars per Thousand Board Feet of logs are reported using standardized log measurements from the “Scribner log table,” which includes expected saw trim. This is larger than the product board foot.
3 Dept. of Commerce, US Census Bureau. New Residential Housing Starts and New Residential Construction Permits, seasonally adjusted, annual rate. Current report is for the prior month. Recent reports are often revised in bold. Also, major revision made each May, reaching 2 1/2 yrs back.
4Regional Multiple Listing Service RMLSTM data, courtesy of Janet Johnston, Prudential Real Estate Professionals Broker, Roseburg, OR. Inventory of Unsold Homes (Ratio of Active Listings to Closed Sales) in Portland Oregon, for most recent month available.
5Freddie Mac. Primary Mortgage Market Survey. 30-year Fixed Rate Mortgages Since 1971, national averages. Updated weekly, current report is for the prior full month.
6) Mortgage-X national average of the most recent weekly rate.
Issue #5-10. © Copyright Rick Sohn, Umpqua Coquille LLC. For permission to reprint, e-mail [email protected] [6]
