By Rick Sohn, PhD
Umqua Coquille LLC
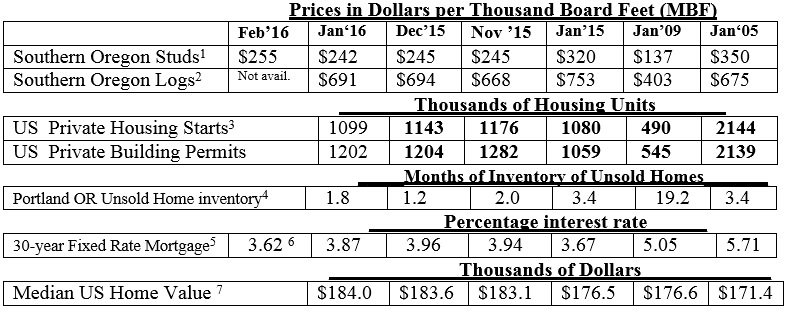
Lackluster product prices, log prices, and housing starts are continuing, despite low unsold home inventories. The recovery has gone flat although fixed rate mortgages seem to get more attractive by the week, for now. Recent trends of lumber, home construction, and housing markets, are compared to 2009 and 2005.
Interpretation and Looking Ahead.
Stud Prices have picked up slightly and log prices have stabilized, for now. Logs are expensive relative to product prices in January. The imbalance of log and product prices has not improved from December to January.
Housing starts have flattened out. The slow upward trend of the last few years is not happening. They are at about the same level as the end of 2014 and the beginning of 2015. Also, for 3 of the last 4 months, housing starts have lagged building permits by about 100,000 units or 8%. It’s the housing starts that really matter. Permits are only a predictor of upcoming housing starts. Perhaps these permits will become housing starts in the Spring.
The unsold inventory of Dec ’15, coming in at a record low of 1.2 months in our last report, looks out of place, when compared to the months immediately before and after, of 1.8 and 2.0 months unsold inventory. Yet, this is a similar pattern to the record spike of unsold inventory in Jan ‘09 to 19.2 months. It too seems out of place, when compared to the months immediately before and after the spike, of 14.1 and 16.6 months, respectively for Dec’08 and Feb ’09. These outlier numbers, both high and low, happened because homes listed and transactions completed, lined up just right to create these two records. In Jan ’09 it was an excess of listings to sales. In Dec ’15 it was an excess of sales to listings.
From August until January, log prices have bounced around within a $26 price range. This is the narrowest range for these months of the last 11 years. Only late 2011 was even close. Although the winter is not nearly over, an $80- $100 price fluctuation between summer and winter prices is not unusual. This steadiness of price is caused by a combination of a severe fire season last summer (that raised the price), and strong recent downward pressure on product prices (that kept the log price down),
As discussed previously, downward pressure on product prices is partially caused by an over-supply of product from Canada because the Trade Agreement has expired and construction in the U.S. is not improving. The imbalanced exchange rate also continues and makes it even more attractive for Canadians to sell product in the U.S. Canadians were getting 1.45 Canadian dollars per US dollar in mid-January, and are now still getting 1.35 Canadian dollars per US dollar. There is a long way to go.
Perhaps an improved Spring construction season will raise the all the boats at least part-way.
Data reports used with permission of: 1Random Lengths. Recent week Kiln Dried 2×4-8′ PET #2/#2&Btr lumber. 2RISI, Log Lines. Douglas-fir #2 Sawmill Log Average, Southern Oregon region. 3 Annualized monthly. US Dept of Commerce. 4Portland, Oregon Regional Multiple Listing Service, courtesy of Janet Johnston, Prudential Real Estate Professionals, Roseburg, OR. 5Freddie Mac. National monthly average. 6 Federal Reserve Bank of St Louis Economic Research, National Average, most recent week. 7Zillow.com, National Median home value. (http://www.zillow.com/or/). © Copyright Rick Sohn, Umpqua Coquille LLC. Issue #9-2. For more information, questions, or permission to reprint, please e-mail me at [email protected].
Disclaimer: Articles featured on Oregon Report are the creation, responsibility and opinion of the authoring individual or organization which is featured at the top of every article.


