By Oregon Family Farm Association
The Oregon Department of Agriculture released an analysis of Oregon’s agricultural production from data gathered since the 1860s. The analysis charts Oregon’s development into one of the country’s most agriculturally rich and diverse states—one that, if history is any guide, will continue to evolve and grow as challenges and opportunities force change and adaptation.
Oregon’s crop production evolves
During the administration of Abraham Lincoln, the U.S. Department of Agriculture (USDA) began keeping meticulous record of annual high and low yields of crops grown in Oregon. As a result, the value of Oregon’s contribution to our nation’s food production can be traced over many decades of growth and development. According to Jim Johnson, land use specialist with the Oregon Department of Agriculture, the data demonstrates “the efficiency and effectiveness of Oregon’s agriculture.”
From the beginning, Oregon farmers showed a commitment to certain staple crops like barley and oats and, by the late 1860’s, wheat and corn, as well. As the state grew and prospered, its rich soil and climate expanded farming output and new agricultural commodities were added. By the mid-1920s, Oregon had also become a major producer of hay, onions, sugarbeets, hops, and various fruits.
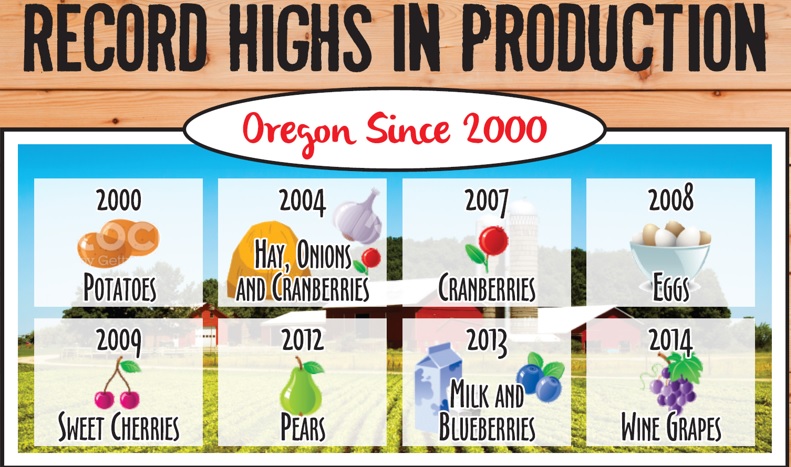
Most recently, Oregon has grown a strong reputation as a berry state. The blueberry, in fact, is the most recent commodity to be added to the USDA’s tracking, having been added to the list in 1978. That said, fruit production has been tracked since the early 1900s. Related production, however, has seen record highs in recent years. In the 2000’s alone, Oregon saw record-setting production of grapes (2014), blueberries (2013), pears (2012), cherries (2009), red raspberries (2007) and cranberries (2007).
Oregon producers adapt to technological advances, other factors
Most of the low yields of various crops occurred early on record keeping. According the Oregon Department of Agriculture, that’s because modern farming technology and improvements in management practices have significantly enhanced agricultural efficiency in production. Moreover, the number of acres and yields has grown substantially from 150 years ago. As a result, certain crops have steadily increased over the decades. Consider these high/low yields and their respective years:
• Onions – 811 tons in 1987 / 5 tons in 1918 (162 times larger)
• Sweet corn – 452,000 tons in 1995 / 2,200 tons in 1934 (more than 20 times larger)
• Potatoes – 1.5 million tons in 2000 / 14,400 tons in 1869 (almost 110 times larger)
Improved technology and management practices don’t necessarily account for all high versus low yields, since certain crops experienced high/low yields in a relatively short time period.
In 1987, for example, apples hit a record high production that still stands—105,000 tons. Just 26 years earlier in 1961, Oregon’s apple production was more than 60% less at 40,800 tons. And green peas increased fivefold from 1977 to 1995.
Weather during the growing season, economic conditions, and demand for certain crops at different times, among other factors, also contribute to swings in crop yields. Additionally, consumer appetites regionally, nationally and even internationally, as well as other things impacting demand for certain crops, affect what farmers decide to plant. For instance, it’s no coincidence that Oregon wine grapes hit record production in 2014, as its status as one of the nation’s top wine producing states continues to grow. Hazelnuts, cranberries and blueberries are all riding a consumer popularity wave, and Oregon is obliging with strong, record-setting yields in recent years.
During economic downswings, like the Great Recession, many farmers tend to diversify what they grow to stabilize business. This causes variations in production of certain crops. Producers also anticipate crops of the future, or in some cases, crops of a soon distant past. That’s because science and related studies, as well as government policy in a sense pick crop winners and losers. When corn-based ethanol was in ascendancy, corn production spiked nationally for the purposes of supporting the ethanol industries. In recent years, the health benefits of blueberries have been hailed by study after study, increasing their popularity and consumption.
Between 2000 and 2012, Oregon’s non-sweet corn production nearly doubled due to several factors and vaulted Oregon into the number corn producing state. The soaring cost of livestock feed in the early 2000s played a big part in the increased production. Livestock famers tired of paying high costs for corn-based feed from the Midwest decided to grow their own.
Though many factors impact the level of various crops’ production, over 150 years Oregon producers have proven industrious at adapting to agriculture demands. Oregon crop production is diverse, which is demonstrated by the sheer number of different crops grown across the state. It’s also responsive, as evidenced by the growth in production of crops suited to the changing preferences of consumers and other economic factors.


Disclaimer: Articles featured on Oregon Report are the creation, responsibility and opinion of the authoring individual or organization which is featured at the top of every article.