Surprise, Another Big Corn and Soybean Crop On the Way
John Newton, Ph.D.
Via Farm Bureau
USDA’s August Crop Production report provides the first survey-based estimate of corn and soybean yields, harvested area and production for the U.S. The objective yield and farm operator surveys were conducted between July 25 and Aug. 8 to gather information on expected yields as of Aug. 1. Please note, crop condition data is not considered in the calculation of objective yields.
Prior to the report’s release, trade estimates put corn yields at an average of 166.2 bushels per acre, with total production at 13.855 billion bushels. Trade estimates for soybeans pointed to 4.212 billion bushels, with an average crop yield of 47.5 bushels per acre. USDA left harvested area unchanged, but came in well abolve the average trade projection with respect to crop yields and production.
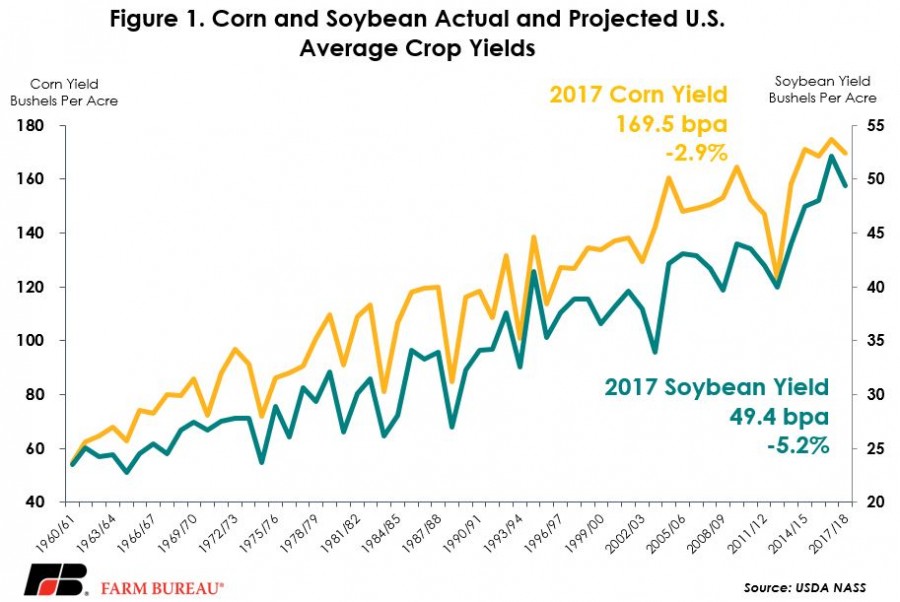
The Aug. 10 Crop Production report forecast the 2017 U.S. average corn yield at 169.5 bushels per acre and total corn production at 14.153 billion bushels, which would be the third-highest on record. The yield estimate was 3.3 bushels above the average trade estimate and 2.7 bushels above the unconditional linear-trend yield of 166.8 bushels per acre. The Aug. 1 corn objective yield data indicate the fifth-highest number of ears on record for the combined 10 objective-yield states (Illinois, Indiana, Iowa, Kansas, Minnesota, Missouri, Nebraska, Ohio, South Dakota and Wisconsin). If realized, 2017/18 corn production would be 6.6 percent below the record crop of 2016/17, and 2.9 percent below last year’s record-high yield.
USDA’s report forecast the 2017 U.S. average soybean yield at 49.4 bushels per acre and total soybean production at a new record-high of 4.381 billion bushels. The yield estimate was 1.9 bushels above the average trade estimate and was 3.5 bushels above the unconditional linear-trend of 45.9 bushels per acre. If realized, 2017/18 soybean yields would be 5.2 percent below the record crop of 2016/17, however, due to higher harvested area, soybean production would be 1.7 percent above last year’s record crop. Figure 1 highlights actual and projected corn and soybean U.S. average yields.
Weather complications this growing season were well documented on Market Intel: Drought Deepens, Ripples Hay Market, Assessing the Possibility of Below Trend U.S. Corn Yield, Corn Planting is Stalled in the Midwest and Crops Currently in Poor Condition, But We Still Have Time. However, the implications for crop yields were not as substantial as many in the trade had anticipated.
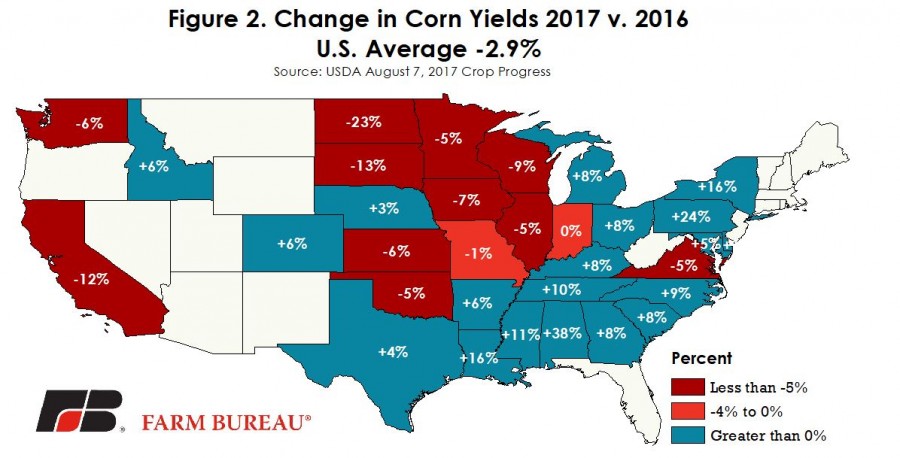
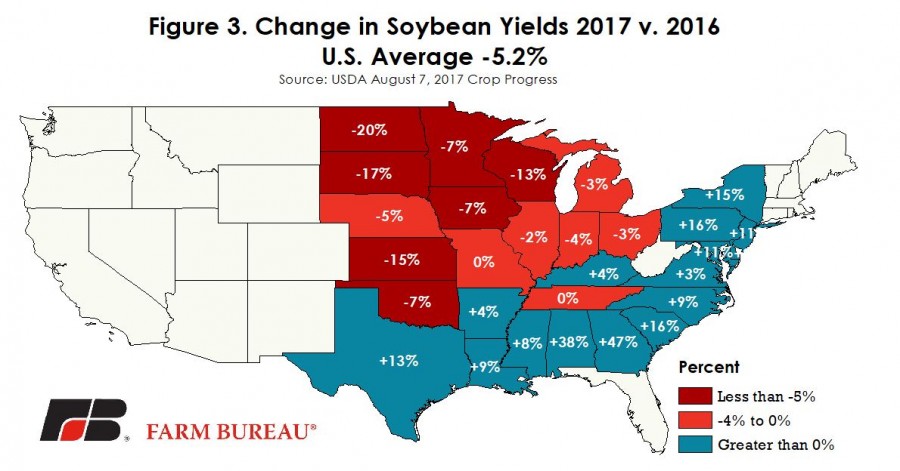
While the survey-based estimates of crop yields did show yield declines from 2016, it’s a major surprise that yields were as high as they were. Portions of the High Plains and Corn Belt are expected to experience modest–to-substantial declines in crop yields from 2016. The decline in corn yields is -13 to -23 percent in the portions of the High Plains, and -5 to -7 percent in the western Corn Belt, Figure 2. For soybeans, year-over-year changes in soybeans yields in the High Plains reached -20 percent, and in the “I-States,” yield declines are projected to be -2 to -7 percent lower, Figure 3.
Will the Crop Really Get Smaller?
Prior to the report, the trade had anticipated that the corn crop could get even smaller. The average trade estimate for the final corn yield was 165 bushels per acre and ranged from 162.4 to 168 bushels per acre. The expectation from the trade that corn yields could ultimately fall lower was primarily driven by poorer crop conditions in 2017 compared to the same period in 2016.
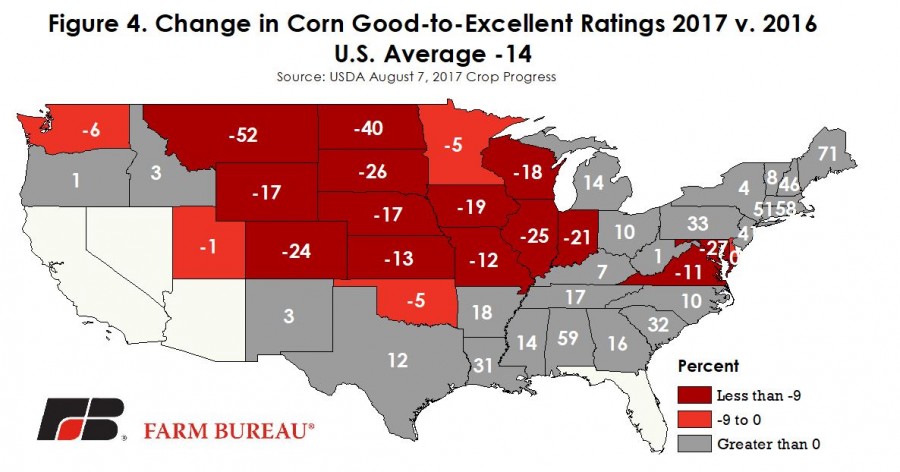
USDA’s Aug. 7, Crop Progress report indicated that 60 percent of the corn crop was in good-to-excellent condition, 14 percent below prior year conditions, but in line with the 5-year average of 61 percent. At the state level, many areas of the corn belt are experiencing poorer crop growing conditions relative to last year, Figure 4. These areas with worse crop conditions (red shaded states) in 2017 represent 84 percent of the corn production in 2016. However, it is the survey-based estimates of crop yields, and not crop condition reports, that are used to derive the August yield estimate.
For soybeans, the average trade estimate for the final yield was 47.2 bushels per acre and ranged from 46.4 to 49.5 bushels per acre. While many in the trade anticipated a smaller soybean crop, it’s not a guarantee as evidenced by USDA’s yield and production estimate. The August crop production report uses survey and yield data to project yields as of Aug. 1, however, for soybeans, August is a very critical month for determining crop yields. USDA’s weather-adjusted trend yield model uses July and August temperature and precipitation data to model soybean yields. Higher temperatures in August will reduce potential soybean yields, while July to August rainfall generally increases yields. It is because August weather data is uncertain that some in the trade are projecting crop yields as high as 49.5 bushels per acre – in line with USDA’s current projection.
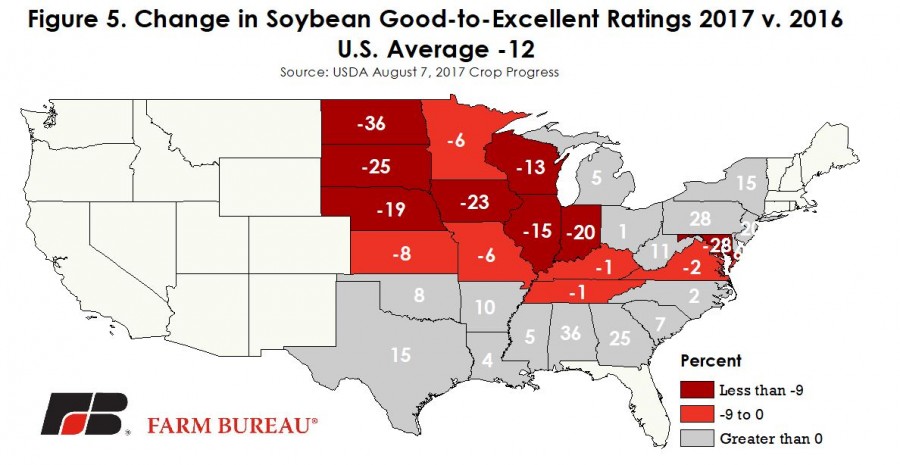
While August weather is unknown, the weather in early July was far from favorable. USDA’s Aug. 7 Crop Progress report indicated that 60 percent of the soybean crop was in good-to-excellent condition, 12 percent below prior-year conditions but in line with the five-year average of 60 percent. At the state-level, crop conditions remain below 2016 levels, Figure 5. Areas with poorer growing conditions in 2017, relative to 2016, represented 81 percent of soybean production in 2016. However, at this point in the growing season, it does not appear that this year’s crop conditions have substantially impacted crop yields relative to the historical trend.
Summary
While corn production is expected to decline, soybean production is now expected to set a new record in 2017. Following the report, new-crop soybean futures declined by 3 percent, or 27 cents, to $9.50 per bushel. New-crop corn futures were down 11 cents, or 3 percent, to $3.75 per bushel.
With the 2017/18 crop still in the ground, a significant amount of uncertainty remains. Given that many fields are far from maturity, these yields and production numbers are subject to revision in the coming months. As more information is revealed about the size of the 2017 crop, attention will then turn to the pace of corn and soybean consumption to derive price expectations throughout the marketing year. With production in line with trend estimates, however, it’s going to take a supply shock elsewhere in the world or substantial boost in consumption to push crop prices back toward their 2011-to-2013 levels.


Disclaimer: Articles featured on Oregon Report are the creation, responsibility and opinion of the authoring individual or organization which is featured at the top of every article.