By American Farm Bureau Federation,
WASHINGTON, D.C., November 12, 2009 – Menu items for a classic Thanksgiving dinner including turkey, stuffing, cranberries, pumpkin pie and all the basic trimmings dropped 4 percent in price this year, according to the American Farm Bureau Federation. AFBF’s 24th annual informal price survey of classic items found on the Thanksgiving Day dinner table indicates the average cost of this year’s feast for 10 is $42.91, a $1.70 price decrease from last year’s average of $44.61.
“As we gather this Thanksgiving for food and fellowship, it’s fitting to take a moment to recognize and give thanks, not only for the abundant food we enjoy as Americans, but for the hard-working farm and ranch families across our nation who produce it,” said AFBF President Bob Stallman.
The AFBF survey shopping list includes turkey, bread stuffing, sweet potatoes, rolls with butter, peas, cranberries, a relish tray of carrots and celery, pumpkin pie with whipped cream, and beverages of coffee and milk, all in quantities sufficient to serve a family of 10.
The cost of a 16-pound turkey, at $18.65 or roughly $1.16 per pound, reflects a decrease of 3 cents per pound, or a total of $.44 per turkey compared to 2008.
Milk, at $2.86 per gallon, dropped $.92 and was the largest contributor to the overall decrease in the cost of the 2009 Thanksgiving dinner.
“Consistent with the retail food price declines seen throughout the year, consumers will pay just a bit less for their Thanksgiving feast this year,” said Jim Sartwelle, an AFBF economist. “Consumers are benefiting at the grocery store from significantly lower energy prices and the effects of the economic slowdown. Again this year, the cost per person for this special meal is less than a typical ‘value meal’ at a fast-food outlet,” Sartwelle said.
Other items showing a price decrease this year were: a ½ pint of whipping cream, $1.55; a dozen brown-n-serve rolls, $2.08; a 1-pound relish tray of carrots and celery, $.72; and a 12-oz. package of fresh cranberries, $2.41. A combined group of miscellaneous items, including coffee and ingredients necessary to prepare the meal (onions, eggs, sugar, flour, evaporated milk and butter) also dropped in price, to $2.50.
Items that increased slightly (less than 5 percent) in price this year were: a 14-oz. package of cubed bread stuffing, $2.65; two 9-inch pie shells, $2.34; and a 30-oz. can of pumpkin pie mix, $2.45.
Two items, green peas and sweet potatoes, stayed the same in price at $1.58 for one pound and $3.12 for three pounds, respectively.
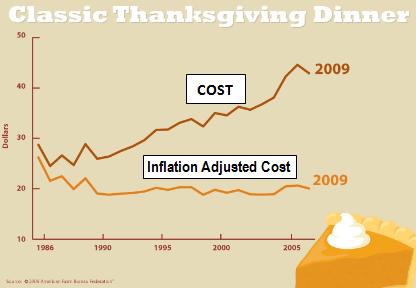
Sartwelle said despite retail price increases during the last year or so, American consumers have enjoyed relatively stable food costs over the years, particularly when adjusted for inflation.
The 4 percent decrease in the national average cost reported this year by Farm Bureau for a classic Thanksgiving dinner tracks closely with the organization’s 2009 quarterly marketbasket food surveys (available online at http://newsroom.fb.org) and the federal government’s Consumer Price Index (available online at http://data.bls.gov/), Sartwelle noted.
Farm Bureau volunteer shoppers are asked to look for the best possible prices, without taking advantage of special promotional coupons or purchase deals, such as spending $50 and receiving a free turkey. Shoppers with an eye for bargains in all areas of the country should be able to purchase individual menu items at prices comparable to the Farm Bureau survey averages. Another option for busy families without a lot of time to cook is ready-to-eat Thanksgiving meals for up to 10 people, with all the trimmings, which are available at many supermarkets and take-out restaurants for around $50 to $75.
The AFBF survey was first conducted in 1986. While Farm Bureau does not make any statistical claims about the data, it is an informal gauge of price trends around the nation.
More than 200 volunteer shoppers from 35 states participated in this year’s survey. Farm Bureau’s survey menu has remained unchanged since 1986 to allow for consistent price comparisons.
Yearly Averages
1986 – $28.74
1987 – $24.51
1988 – $26.61
1989 – $24.70
1990 – $28.85
1991 – $25.95
1992 – $26.39
1993 – $27.49
1994 – $28.40
1995 – $29.64
1996 – $31.66
1997 – $31.75
1998 – $33.09
1999 – $33.83
2000 – $32.37
2001 – $35.04
2002 – $34.56
2003 – $36.28
2004 – $35.68
2005 – $36.78
2006 – $38.10
2007 – $42.26
2008 – $44.61
2009 – $42.91
Disclaimer: Articles featured on Oregon Report are the creation, responsibility and opinion of the authoring individual or organization which is featured at the top of every article.


