By Rick Sohn
Umpqua Coquille LLC
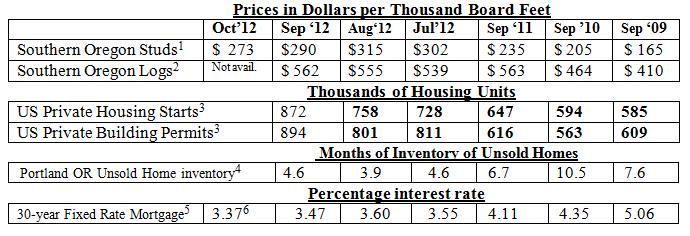
Housing starts and building permits broke out while mortgage interest rates are at an all-time low. Steady, slow climb in housing has only risen to the WORST level reached in 2 recent recessions. Four-year market trends of lumber, logs, housing, and mortgage statistics are shown below.
Interpretation
As predicted would happen last month, logs reported higher this month, and the same is is predicted next month, due to the wet weather following so closely on the fire season closures in the Northwest, both of which create a shortages of logs. With log prices going up, and 2×4 prices going down, the mills will get more squeezed, although in September, the 2×4 price still exceeded half the log price.
Who can believe the interest rates!!! 3.37% last week for the average for a 30-year fixed rate loan. This is the lowest rate since 1971, when these records were first tracked.
This month’s housing starts and building permits posted a breakout month. From January through September, only ONE of housing starts and building permits set a new 2012 record high each month, for the year. FINALLY, both housing starts and building permits set new 2012 highs in the same month, and by substantial margins. Starts are 15% ahead, and permits are ahead 10% of previous highs for 2012. As has been the case many times, these are the highest figures in 5 years — since the 2007-2009 reset.
The Financial Times of October 19, points out what is perhaps the obvious – Don’t break out the champagne just yet. This is NOT a full recovery yet, only the right direction. The “recovery” of homebuilding has finally reached, roughly, the LOWEST home construction levels of the 1981 and 1990 recessions. As evidence of this, residential investment peaked at 6% of Gross Domestic Product in 2005. 4% of GDP from residential investment is a more normal level. But today, residential investment languishes at just 2% of GDP! This investment rate is so low, that even steady increases do not add up fast. Meaning that dollar-wise, construction is not fueling our way out of the recession this time. Yet, it is helping.
The larger effect of the slowly increasing home value and residential investment is that it may explain the improvement of Consumer feelings overall, and people are spending more. The US Consumer Confidence Index was 70.3 in September, while the Thomson Reuters University of Michigan consumer sentiment index now stands at 82.6%, as reported last Saturday. Refinancing, which seems sometimes to be more of an exercise, than real economic growth, has the benefit of reallocating cash away from the home mortgage, allowing consumers to spend on other things. It will be interesting to see what effect the election has on Consumer’s Confidence and sentiment.
In a sign of industry consolidation, due to the low volumes of wood product production, the “Southern Oregon Mills” price for Precision End Trimmed Coastal Stud Grade which has been quoted in this report through September 2012, and which has been a stable of Random Lengths reporting for decades, is no longer being separated as a special reporting area and grade, as of October 2012. According to Random Lengths, most manufacturers now produce the very similar Coastal 2×4-8’ Precision End Trimmed #2 or #2 and better, which now includes the Southern Oregon Mills that produce a stud grade. Looking back over selected months of the last few years, and after consulting with Random Lengths, the two prices track very closely, often the same, but not generally more than $5.00 apart. Going forward, the number reported will be the Coastal PET #2/#2 and Better. Historical prices will not be changed.
Data reports used with permission of:
1- Random Lengths. Through Sept. 2012, 2”x4”x8’ precision end trimmed hem-fir stud grade from Southern Oregon mills. Starting Oct. 2012 the stud grade has been consolidated with and will be reported as Coastal region as #2/#2&Btr. Price reported is Dollars per Thousand Board Feet generally for the third week of the month. One “board foot” of product measures 12 inches by 12 inches by one inch thick.
2- RISI, Log Lines. Douglas-fir #2 Sawmill Log Average Region 5 price. Current report is for the prior month. Dollars per Thousand Board Feet of logs are reported using standardized log measurements from the “Scribner log table,” which includes expected saw trim. This is larger than the product board foot.
3- Dept. of Commerce, US Census Bureau. New Residential Housing Starts and New Residential Construction Permits, seasonally adjusted, annual rate. Current report is for the prior month. Recent reports are often revised in bold. Also, major revision made each May, reaching 2 1/2 yrs back.
4- Regional Multiple Listing Service RMLSTM data, courtesy of Janet Johnston, Prudential Real Estate Professionals Broker, Roseburg, OR. Inventory of Unsold Homes (Ratio of Active Listings to Closed Sales) in Portland Oregon, for most recent month available.
5- Freddie Mac. Primary Mortgage Market Survey. 30-year Fixed Rate Mortgages Since 1971, national averages. Updated weekly, current report is for the prior full month.
6- Mortgage-X national average of the most recent weekly rate.
Issue #5-10. © Copyright Rick Sohn, Umpqua Coquille LLC. For permission to reprint, e-mail [email protected]
Disclaimer: Articles featured on Oregon Report are the creation, responsibility and opinion of the authoring individual or organization which is featured at the top of every article.


