By Rick Sohn,
Umpqua Coquille LLC
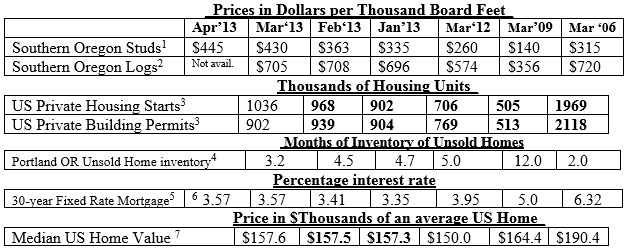
Wood products set records in April and pushed all prices higher, as log shortages still are an issue. Housing starts finally broke through 1 million for the first time in 5 years. Seven-year trend of lumber, logs, housing, and mortgage statistics are shown below.
$445 for studs is higher than any number I can remember. But looking closely at weekly reports: $395 on March 15
$430 on March 22
$452 on March 29
$460 on April 5 and 12
$445 on April 19
$415 on April 26
Random Lengths printed a high of $417 as a monthly average in March, 2005. This “Timber industry Reports” usually uses the third week of the month. Normally, prices of lumber above $400 are very short-lived but have been going now for 6 weeks. Current issues of Random Lengths report price weakness, but weakness that is still above $400 is an exceptionally strong number by historic standards. These prices happen because basic production infrastructure cannot keep up with demand, for product. For simplicity, this report tracks studs, but other products are also following suit. Two lessons here: No rest for lumber salesmen, and low cost studs at the big boxes may be a thing of the past, for now.
With such a strong spike in stud prices, the March stud number is well over 50% of the log number, so good money is being made by mills, as well as by the timberland owners. A steep drop in both stud and log prices can be expected, as the increased supply of logs from summer road systems becomes a factor. Log sellers tell me that these decreases in price will be more evident when reported next month.
Housing starts are setting a new high, again, finally surpassing 1 million starts annualized – the first time since June, 2008. This is another important milestone. More markets are becoming seller’s markets. Unsold inventory is hovering around very healthy levels. The 30-year fixed rate mortgage is stabilized, moving slowly upward, each month.
Zillow median home value prices are interesting. A study of these numbers shows a significant lag in the low price, compared to the other measures in this report. The low reported in in 2012, fully 3 years after the housing starts, building permits and stud and log prices hit their lows. Of course, many factors contribute to the lagging home prices, not the least of which is the SLOWNESS of the recovery.
One of our next milestones will be when housing starts and building permits both print above 1 million units in the same month.
Data reports used with permission of:
1Random Lengths. Through Sept. 2012, 2”x4”x8’ precision end trimmed hem-fir stud grade from Southern Oregon mills. Starting Oct. 2012 the stud grade was consolidated with and is now reported as Kiln Dried Studs, Coast Hem-Fir 2x4x8’ PET #2/#2&Btr. Price reported is Dollars per Thousand Board Feet, generally the third week of the month. One “board foot” of product measures 12 inches by 12 inches by one inch thick.
2RISI, Log Lines. Douglas-fir #2 Sawmill Log Average Region 5 price. Current report is for the prior month. Dollars per Thousand Board Feet of logs are reported using standardized log measurements from the “Scribner log table,” which includes expected saw trim. This is much larger than a product board foot.
3 Dept. of Commerce, US Census Bureau. New Residential Housing Starts and New Residential Construction Permits, seasonally adjusted, annual rate. Current report is for the prior month. Recent reports are often revised in bold. Also, major revision made each May, reaching 2 1/2 yrs back.
4Regional Multiple Listing Service RMLSTM data, courtesy of Janet Johnston, Prudential Real Estate Professionals Broker, Roseburg, OR. Inventory of Unsold Homes (Ratio of Active Listings to Closed Sales) in Portland Oregon, for most recent month available.
5Freddie Mac. Primary Mortgage Market Survey. 30-year Fixed Rate Mortgages Since 1971, national averages. Updated weekly, current report is for the prior full month.
6Mortgage-X Most recent weekly rate of 30-year Fixed Rate Mortgages, national average.
7Zillow.com Median value of homes sold in the United States during the month, weighted according to the population of each area. The Median is the midpoint value with equal numbers of homes selling above and below this value each month. Medians tend to remove the effect of outlier values.Revisions in bold
Issue #6-4. © Copyright Rick Sohn, Umpqua Coquille LLC.
For permission to reprint, e-mail [email protected]
Disclaimer: Articles featured on Oregon Report are the creation, responsibility and opinion of the authoring individual or organization which is featured at the top of every article.


