 [5]
[5]
Nearly 1 in 6 work in Oregon’s food industry
Josh Lehner
Office of Economic Analysis
When our office discusses Oregon’s world class strengths, we tend to focus primarily on things like timber, semiconductors, and migration, with only passing reference to the others, like UAVs and food and beverage. This is in part due to the fact we have spent less time researching these topics; alcohol [6] being [7] an [8] exception [9]. And also in part because it is difficult to properly frame the conversation given that residents in every state eat and drink. However our office is asked periodically about the state’s food and beverage sector and also the tie-in with tourism. Consider this post a first effort to help quantify the discussion and highlight how Oregon differs from other states. Our office is indebted to Portland State’s Northwest Economic Research Center which produced a tremendous report [10] for the City of Portland a few years ago. It breaks down the food economy into segments representing different portions of the supply chain. The report goes from farm to table, but with economic data. What follows below borrows heavily from the NERC report.
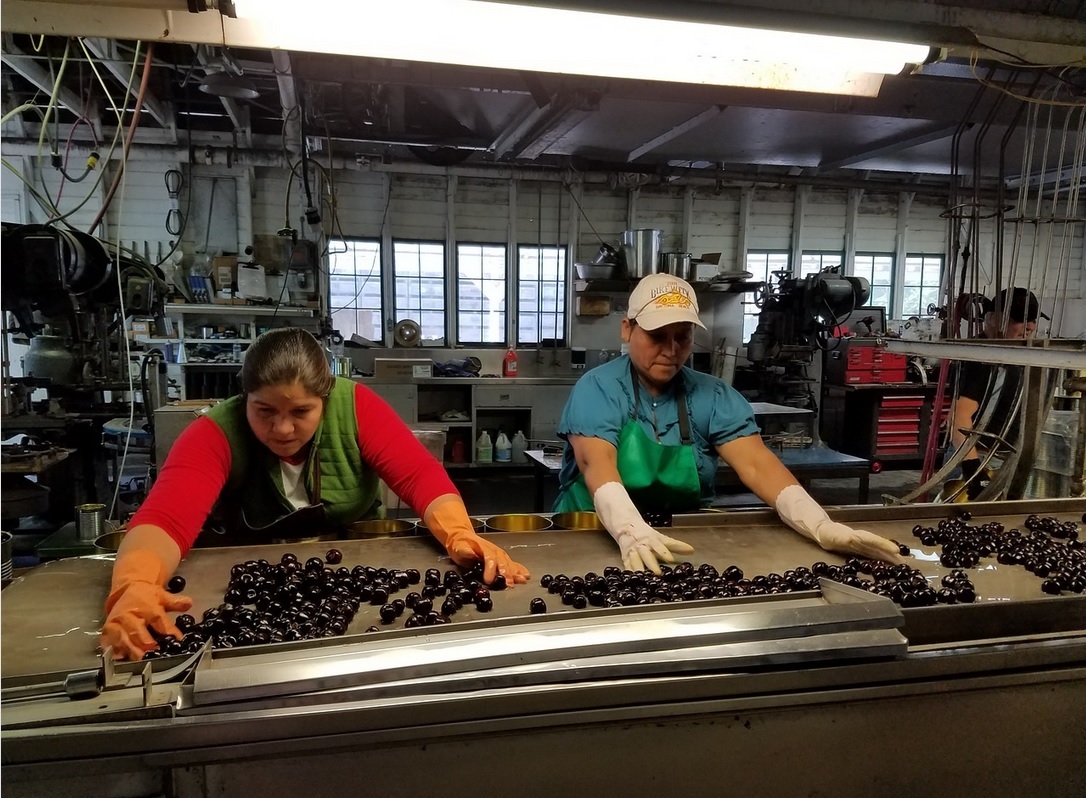
Oregon’s food economy overall employs nearly 290,000 workers, or 15% of the state workforce. It accounts for 4-5% of state GDP in recent years. One-third of these workers — nearly 100,000 — are in the production, processing, and distribution segments of the food economy. It is here where Oregon has a distinct comparative advantage, and a growing national share of the market. However, most of us only really interact with the fourth segment of the food economy: food services. The lion’s share of jobs are found in these food services, which includes restaurants, supermarkets, specialty food and beverage stores, food carts and the like. And while these services garner the (inter)national attention, and satisfy our tastebuds, they play a lesser role in terms of the economic impact and what makes Oregon unique from an industrial structure perspective. This is partially because food services are largely driven by population and consumer spending patterns. Even as Oregon may be home to award-winning chefs and renown restaurants, residents of other states also go out to eat. Standard economic data is insufficient to distinguish between the quality of products or services sold.
 [11]
[11]
Where Oregon’s food economy differs from other states is on the production and processing portions of the food economy. The more famous food services are an integral segment, a byproduct and growth off of the fact Oregon is home to successful producers and processors of the local food economy. Specifically, Oregon’s location quotient for food production is 2.6, meaning the concentration of agricultural jobs is two and a half times what it is nationwide. This is primarily driven by crops (grains, fruits, vegetables, etc) and fishing. Additionally, Oregon’s location quotient for food processing is 1.5 meaning the local concentration 50% larger than in the average state.
As seen in the chart above, the growth in food processing really stands out both here in Oregon, and when we look across the country. These processing jobs (food manufacturing plus beverage manufacturing) are being driven not just by overall economic growth, but also a regional shift, or regional competitive effect. Using a shift-share analysis, the overall growth in food processing jobs in Oregon is 70% regional competitive effect. Contrast these processing gains with those seen in food production and food services which are 99% and 97%, respectively, driven by the national growth and the industry mix components of the shift-share analysis. In other words, the growth seen in much of the food economy can be tied to general economic and industry trends. However, Oregon’s food processing growth is predominantly due to Oregon gaining a significantly larger slice of the pie.
To help frame these gains I looked at changes across all states over the past decade. The next few charts focus just on food manufacturing (NAICS 311) and leaves beverages to the side for a moment. Here you can see Oregon is among the top performers for job growth both in the absolute number of jobs gained, and in percentage terms. [12]
[12]
What is most surprising to me, however, is how broad-based these gains have been across the various subsectors here in Oregon and across the state from a geographic perspective. Anecdotally, our office has heard reports about the growth of the frozen food companies here in the Willamette Valley as they import more products during the offseason to keep production high and employees working, in addition to some of the bread and bakery growth in the Portland region. However in digging a little bit deeper, it is clear that those ancedotal reports in recent years are just a portion of the overall growth.
Nearly every single subsector of food manufacturing has added jobs in the past decade. Yes, dairy manufacturers are flat over the 10 years but this includes many years of growth followed by a large drop in 2015, only to resume growth again in 2016 and 2017. I am unsure of what is happening there. Additionally it should be pointed out that a small portion of these gains, a few hundred at most, are due to the growth of the recreational marijuana industry. Companies making edibles are classified into food manufacturing [13], mostly into the bakeries and confectionery product subsectors. However the marijuana gains are very small compared with the overall growth seen in the past decade.
 [14]
[14]
Additionally, the food manufacturing job gains are widespread across the state. The largest concentration of firms and employment is in the Portland region, however the strongest gains in percentage terms are seen in the Rogue Valley, Central Oregon, and the Columbia Gorge.
 [15]
[15]
Given the strong growth in the past 15 years, and expectations that the food economy will continue to outpace the overall economy moving forward, what types of jobs are we talking about? In the NERC report, they highlight both wages and skills needed (educational attainment) for most of these jobs from an industry and occupational perspective. On net, food economy jobs pay relatively low wages. In the job polarization research [16], the food production and food service jobs are considered low-wage occupations, while the food processing and food distribution jobs are considered middle-wage (or lower middle-wage). That said, the largest occupations included in the food economy do not require formal education beyond high school, with the exception of truck drivers for the distribution. Among all Oregon jobs that do not require a college degree, food economy jobs — particularly food processing and distribution — pay similar to others in this broad group. [17]
[17]
Finally, the market for Oregon-grown and Oregon-made products is much larger outside the state than inside the state. As such, Oregon firms are finding success in exporting their products across the country and around the world. For smaller producers and manufacturers, finding a niche market is one way to help weather both commodity price swings and competition from larger firms. In the past decade, Oregon’s food producers and processors export $2-3 billion in value of products internationally.
 [18]
[18]
Bottom Line: Oregon’s food economy is helping drive overall growth in the state. Above average gains are expected in the coming years as well. The largest segment of the food economy are the services, which garner much of the deserved acclaim. However it is the food production and food processing where Oregon stands apart from most states. The growth in local food processing means Oregon is getting a larger slice of the value-added manufacturing segment of the food economy. These gains are broad-based across subsectors and regions of the state.